The NERACOOS Ocean and Weather Climate Display is an interactive charting tool that allows you to view the annual mean conditions against a 10+ year average of means for that data type. You can choose the buoy location, data type and averaging time period from the drop down lists at the top of the tool and the chart will automatically update with the information for the parameters you have selected.
Use the image below to identify the individual components of the tool and the various selection menus. More detail is provided below the image for each component.
Please click here if you are experiencing any difficulties using the tool.

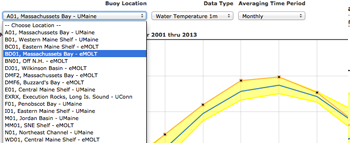
1) To change the buoy location, select from the first drop down list.
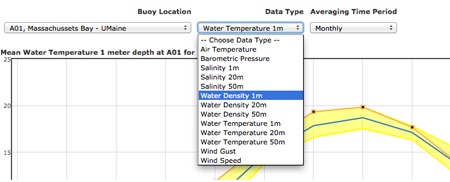
2) To change the data type, select an option from the second drop down list.
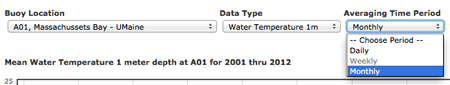
3) To change the averaging time period (Daily or Monthly at this time), choose from the third drop down list.
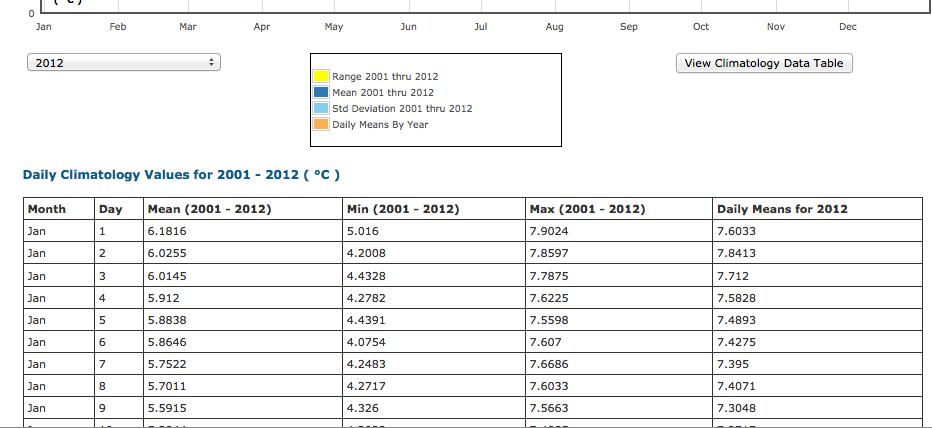
4 & 5) To change the year, click the arrows at the top of the chart or select from the drop down list under the chart.
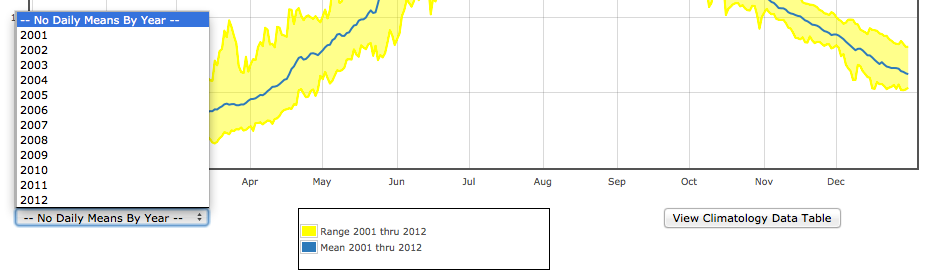
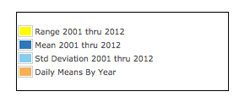
7) A legend can be found under the chart to identify the individual components of the chart.
8) You can also view the data by clicking the 'View Data Table' button under the chart.
If you are experiencing any difficulties with the tool, please try clearing your cookies/cache using links below. If you continue to have difficulty, please contact us at [email protected] and be sure to include detail about issues you are having and any error messages you've encountered.
Clearing cookies | Clearing web cache
![]()